Working security analysis I tend to jump back and fourth between Linux and Windows 10 a lot. Like most in this profession I tend to gain strong muscle memory with some tools and that means we like to keep using those tools no matter what kind of system we are on. For developing quick and dirty C programs that help me through my day I am stuck on the GDB debugger. This guide is about getting GDB on Windows 10 quick and easy like.
So here we go.
First thing we want to do is download codeblocks with mingw:

Navigate to where you downloaded the Codeblocks installer and run it:

Next we want to open file explorer and navigate to the directory that Codeblocks was installed to. We need to find where the gdb executable is located among the Codeblocks directory tree. It is usually located at C:\Program Files (x86)\MinGW\\gdb32\bin:

Then we want to again head to file explorer:

Right click on "This PC" in file explorers left main menu of directories. Then click on properties on the bottom of the properties menu:

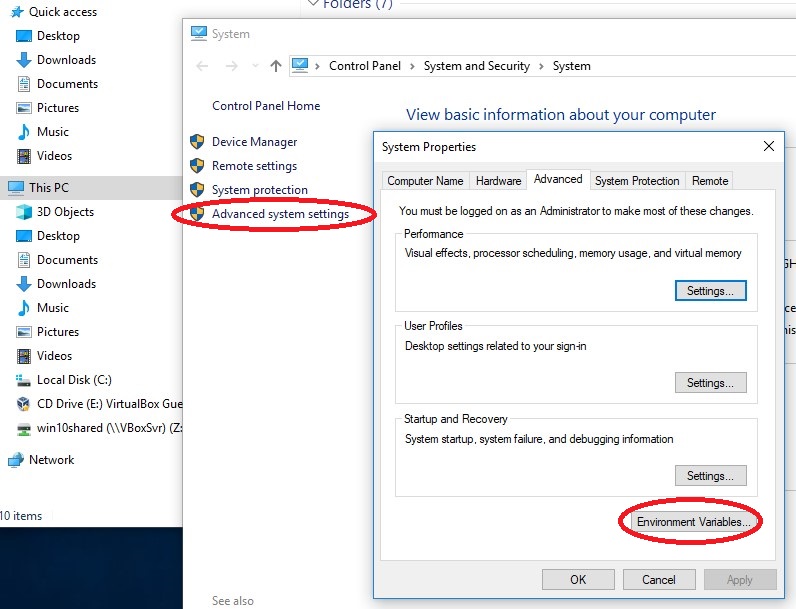
Click on "Advanced system settings". That will bring up the System Properties dialog. In that dialog click on the "Environment Variables" button at the bottom:
Now the Environment Variables dialog should pop up. You need to click on the "Path" entry in the "System variables" section as the image shows below. Then click "Edit":

That will bring up the "Edit environment variable" dialog. In that dialog click on "New", then navigate to the bottom of list in that same dialog and paste the gdb folder location url that you copied in an earlier step:

Now reboot Windows 10. After you have rebooted open the windows command prompt and type:
gdb "any executable"
A good example is shown below:

There you go, like i said quick and easy. If you need to set up a C development environment in Windows 10 then this Windows 10 C dev environment is a good guide.
Thank you for reading! I hope you found some of this useful!!!
Comments
Post a Comment